
DISCREET PACKAGING
Secure Payment
ORDERED BEFORE 13.30
Dispatched the same day.
CONDOMS IN ALL SIZES
Enjoy a condom that fits.
CARBON NEUTRAL
Since 2011.
Penile Circumference and condoms - Circumference of penis after sexual stimulus: grouped by response
Penile Circumference and condoms - Introduction
Penile Circumference and condoms -Method - Measurements
Penile Circumference and condoms - Method - Subjects and stimuli
Penile Circumference and condoms - Circumference of penis before sexual stimulus presentation
Penile Circumference and condoms - Circumference of penis after sexual stimulus presentation
Penile Circumference and condoms - Circumference of penis after sexual stimulus: grouped by response
Penile Circumference and condoms - Circumference of penis after sexual stimulus: grouped by age
Penile Circumference and condoms -Circumference of penis during sleep: grouped by response
Penile Circumference and condoms - Concluding remarks
Penile Circumference and condoms - Reference
Penile Circumference and condoms -Appendix: The Kinsey Data
3 Results
3.3 Circumference of penis after sexual stimulus: grouped by response
Figure 5 shows the distribution of penile circumferences grouped by response (in mm circumference change, n=152). Table 5 shows the frequency distribution for subjects with a circumference change of more than 10 mm (n=74). For this group the mean circumference was 122 mm (standard deviation 16 mm, range 90 - 161 mm, median 121 mm). Twenty-five percent of these subjects obtained a penile circumference of less than 110 mm, seventy-five percent obtained a penile circumference of less than 131 mm, and ninety percent obtained a penile circumference of less than 142 mm.
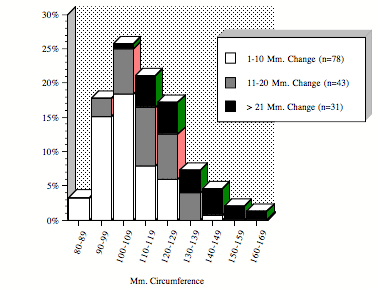
Figure 5. Distribution of circumferences (mm) of the erect penis, grouped by penile response (N= 152).
Table 5. Frequency distribution of penile circumference after sexual stimulus, subjects
with circumference change > 10 mm only (N=74)
| Interval |
≥ mm |
< mm |
n |
Percentage |
Cum. Percentage |
|
1 |
090 |
100 |
04 |
05.4% |
05.4% |
| 2 | 100 | 110 | 11 | 14.9% | 20.3% |
| 3 | 110 | 120 | 20 | 27.0% | 47.3% |
| 4 | 120 | 130 | 17 | 22.9% | 70.2% |
| 5 | 130 | 140 | 11 | 14.9% | 85.1% |
| 6 | 140 | 150 | 06 | 08.1% | 93.2% |
| 7 | 150 | 160 | 03 | 04.1% | 97.3% |
| 8 | 160 | 170 | 02 | 02.7% | 100.0% |